Prerequisite
- Python 2.7
- MySQL
- Python Dash
- PyCharm Community Edition
Walk-through
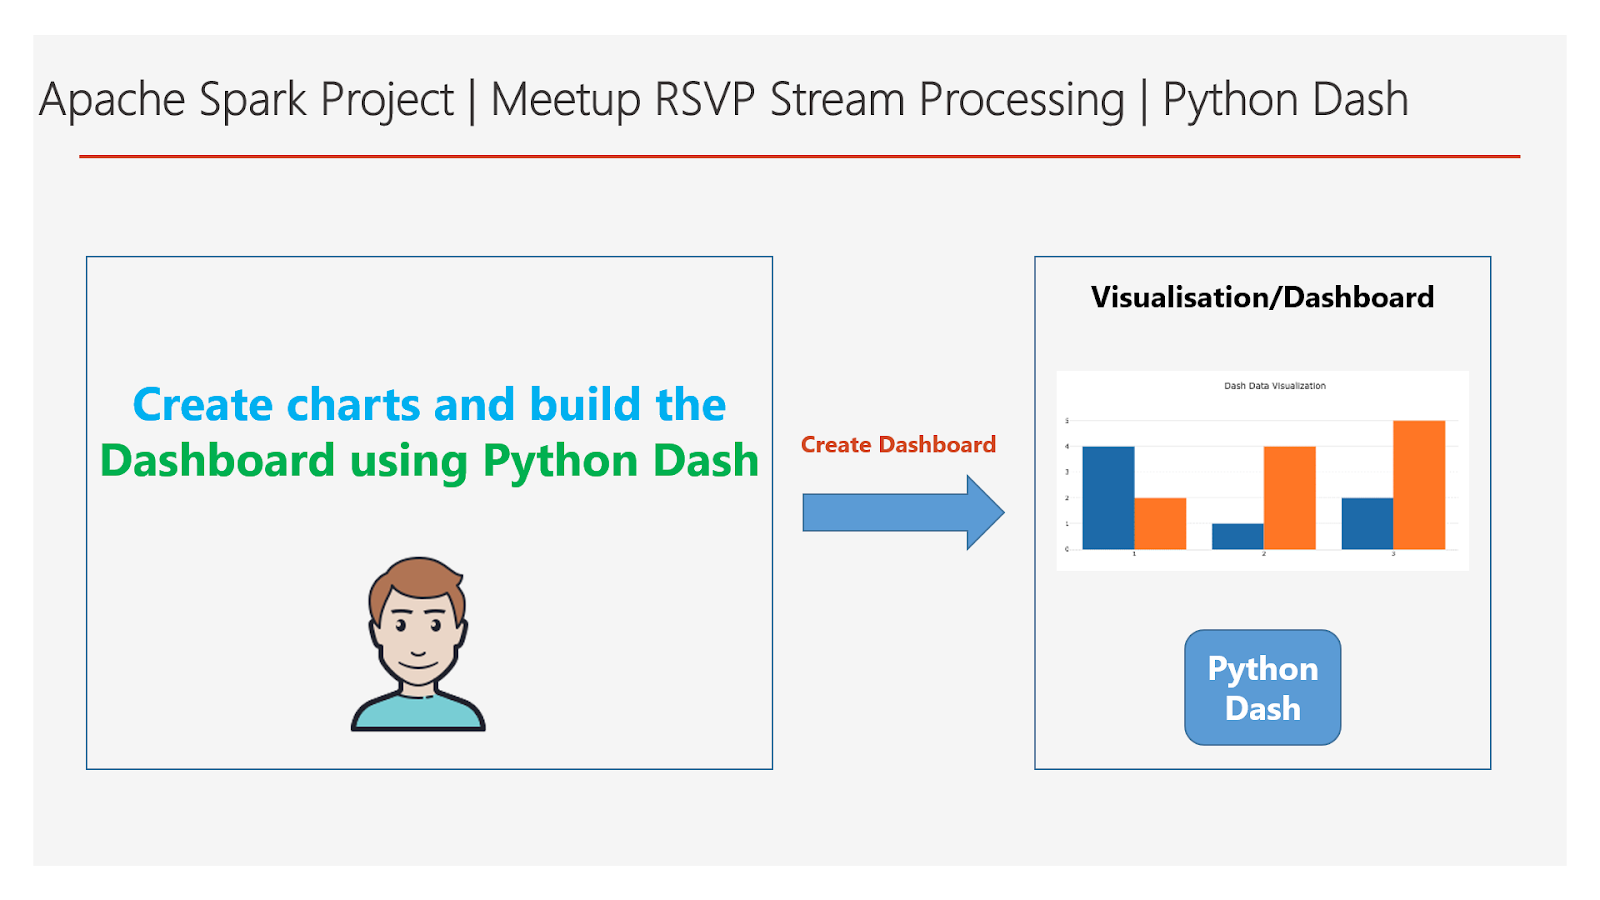
In this article, we are going to build the charts/graphs and dashboard in the "Real-Time Meetup.com RSVP Message Processing Application" using Python package called Dash.In this project we are going to fetch the processed data from MySQL database table and show it in the dashboard.

Install the Python package "Dash" for building the dashboard application using below pip commands.
pip install dash
pip install dash-renderer
pip install dash-core-components
pip install dash-html-components
pip install plotly
pip install dash-table-experiments
Now let us go through each code block in the app.py python program and understand how it is works.
# Code Block 1 Starts
import dash
import dash_html_components as dhtml
import dash_core_components as dcc
from dash.dependencies import Input, Output
import dash_table
import pandas as pd
from sqlalchemy import create_engine

import time
import plotly

# Creating Dash Application
external_stylesheets = ['https://codepen.io/chriddyp/pen/bWLwgP.css']

app = dash.Dash(__name__, external_stylesheets=external_stylesheets)
app.scripts.config.serve_locally=True
# Code Block 1 Ends
# Code Block 2 Starts
def build_pd_df_from_sql():
    print("Starting build_pd_df_from_sql: " + time.strftime("%Y-%m-%d %H:%M:%S"))
    current_refresh_time_temp = None

    host_name = "localhost"
    port_no = "3306"
    user_name = "root"
    password = "root"
    database_name = "meetup_rsvp_db"

    mysql_jdbc_url = "mysql+mysqlconnector://" + user_name + ":" + password + "@" + host_name + ":" + port_no + "/" + database_name
    print("Printing JDBC Url: ")
    print(mysql_jdbc_url)

    db_engine = create_engine(mysql_jdbc_url, echo=False)

    sql_query_for_grid = "select group_name, group_country, group_state, group_city, group_lat, group_lon, response, response_count, batch_id from meetup_rsvp_message_agg_detail_tbl where batch_id in (select max(batch_id) from meetup_rsvp_message_agg_detail_tbl) order by response_count desc limit 10"

    df1 = pd.read_sql_query(sql_query_for_grid, db_engine)

    sql_query_for_bar_graph = "select group_name, case when response = 'yes' then response_count else 0 end as yes_response_count, case when response = 'no' then response_count else 0 end as no_response_count from meetup_rsvp_message_agg_detail_tbl where batch_id in (select max(batch_id) from meetup_rsvp_message_agg_detail_tbl) order by response_count desc limit 10"

    df2 = pd.read_sql_query(sql_query_for_bar_graph, db_engine)

    print("Completing build_pd_df_from_sql: " + time.strftime("%Y-%m-%d %H:%M:%S"))
    return {"df1": df1, "df2": df2}
# Code Block 2 Ends
# Code Block 3 Starts
df1_df1_dictionary_object = build_pd_df_from_sql()
df1 = df1_df1_dictionary_object["df1"]
df2 = df1_df1_dictionary_object["df2"]
# Code Block 3 Ends
# Code Block 4 Starts
# Assign HTML Content to Dash Application Layout
app.layout = dhtml.Div(
    [
        dhtml.H2(
            children="Real-Time Dashboard for Meetup Group's RSVP",
            style={
                "textAlign": "center",
                "color": "#4285F4",
                'font-weight': 'bold',
                'font-family': 'Verdana'
            }),
        dhtml.Div(
            id = "current_refresh_time",
            children="Current Refresh Time: ",
            style={
                "textAlign": "center",
                "color": "black",
                'font-weight': 'bold',
                'fontSize': 10,
                'font-family': 'Verdana'
            }
        ),
        dhtml.Div([
            dhtml.Div([
                dcc.Graph(id='live-update-graph-bar')
                ]),

            dhtml.Div([
                    dhtml.Br(),
                    dash_table.DataTable(
                        id='datatable-rsvp',
                        columns=[
                            {"name": i, "id": i} for i in sorted(df1.columns)
                        ],
                        data=df1.to_dict(orient='records')
                    )
                ], className="six columns"),
        ], className="row"),

        dcc.Interval(
            id = "interval-component",
            interval = 10000,
            n_intervals = 0
        )
    ]
)
# Code Block 4 Ends
# Code Block 5 Starts
@app.callback(
    Output("current_refresh_time", "children"),
    [Input("interval-component", "n_intervals")]
)
def update_layout(n):
    # current_refresh_time
    global current_refresh_time_temp
    current_refresh_time_temp = time.strftime("%Y-%m-%d %H:%M:%S")
    return "Current Refresh Time: {}".format(current_refresh_time_temp)
# Code Block 5 Ends
# Code Block 6 Starts
@app.callback(
    Output("live-update-graph-bar", "figure"),
    [Input("interval-component", "n_intervals")]
)
def update_graph_bar(n):
    traces = list()
    bar_1 = plotly.graph_objs.Bar(
            x=df2["group_name"],
            y=df2["yes_response_count"],
            name='Yes')
    traces.append(bar_1)
    bar_2 = plotly.graph_objs.Bar(
            x=df2["group_name"],
            y=df2["no_response_count"],
            name='No')
    traces.append(bar_2)
    layout = plotly.graph_objs.Layout(
        barmode='group', xaxis_tickangle=-25, title_text="Meetup Group's RSVP Count",
        title_font=dict(
            family="Verdana",
            size=12,
            color="black"
        ),
    )
    return {'data': traces, 'layout': layout}
# Code Block 6 Ends
# Code Block 7 Starts
@app.callback(
    Output('datatable-rsvp', 'data'),
    [Input("interval-component", "n_intervals")])
def update_table(n):
    global df1
    global df2

    print("In update_table")

    df1_df1_dictionary_object = build_pd_df_from_sql()
    df1 = df1_df1_dictionary_object["df1"]
    df2 = df1_df1_dictionary_object["df2"]

    return df1.to_dict(orient='records')
# Code Block 7 Ends
# Code Block 8 Starts
if __name__ == "__main__":
    print("Starting Real-Time Dashboard for Meetup Group's RSVP ... ")
    app.run_server(port=8191, debug=True)
# Code Block 8 Ends
Summary
In this article, we have successfully built the charts/graphs and dashboard using Python package called Dash. Please go through all these steps and provide your feedback and post your queries/doubts if you have. Thank you. Appreciated.You can build this project and run on your Spark and Hadoop cluster or reach to us for FREE Spark and Hadoop VM.
Request for FREE Spark and Hadoop VM
Click here for more details about FREE Spark and Hadoop VM
Happy Learning !!!


1 Comments
can u share ur code into giithub repositery
ReplyDelete